
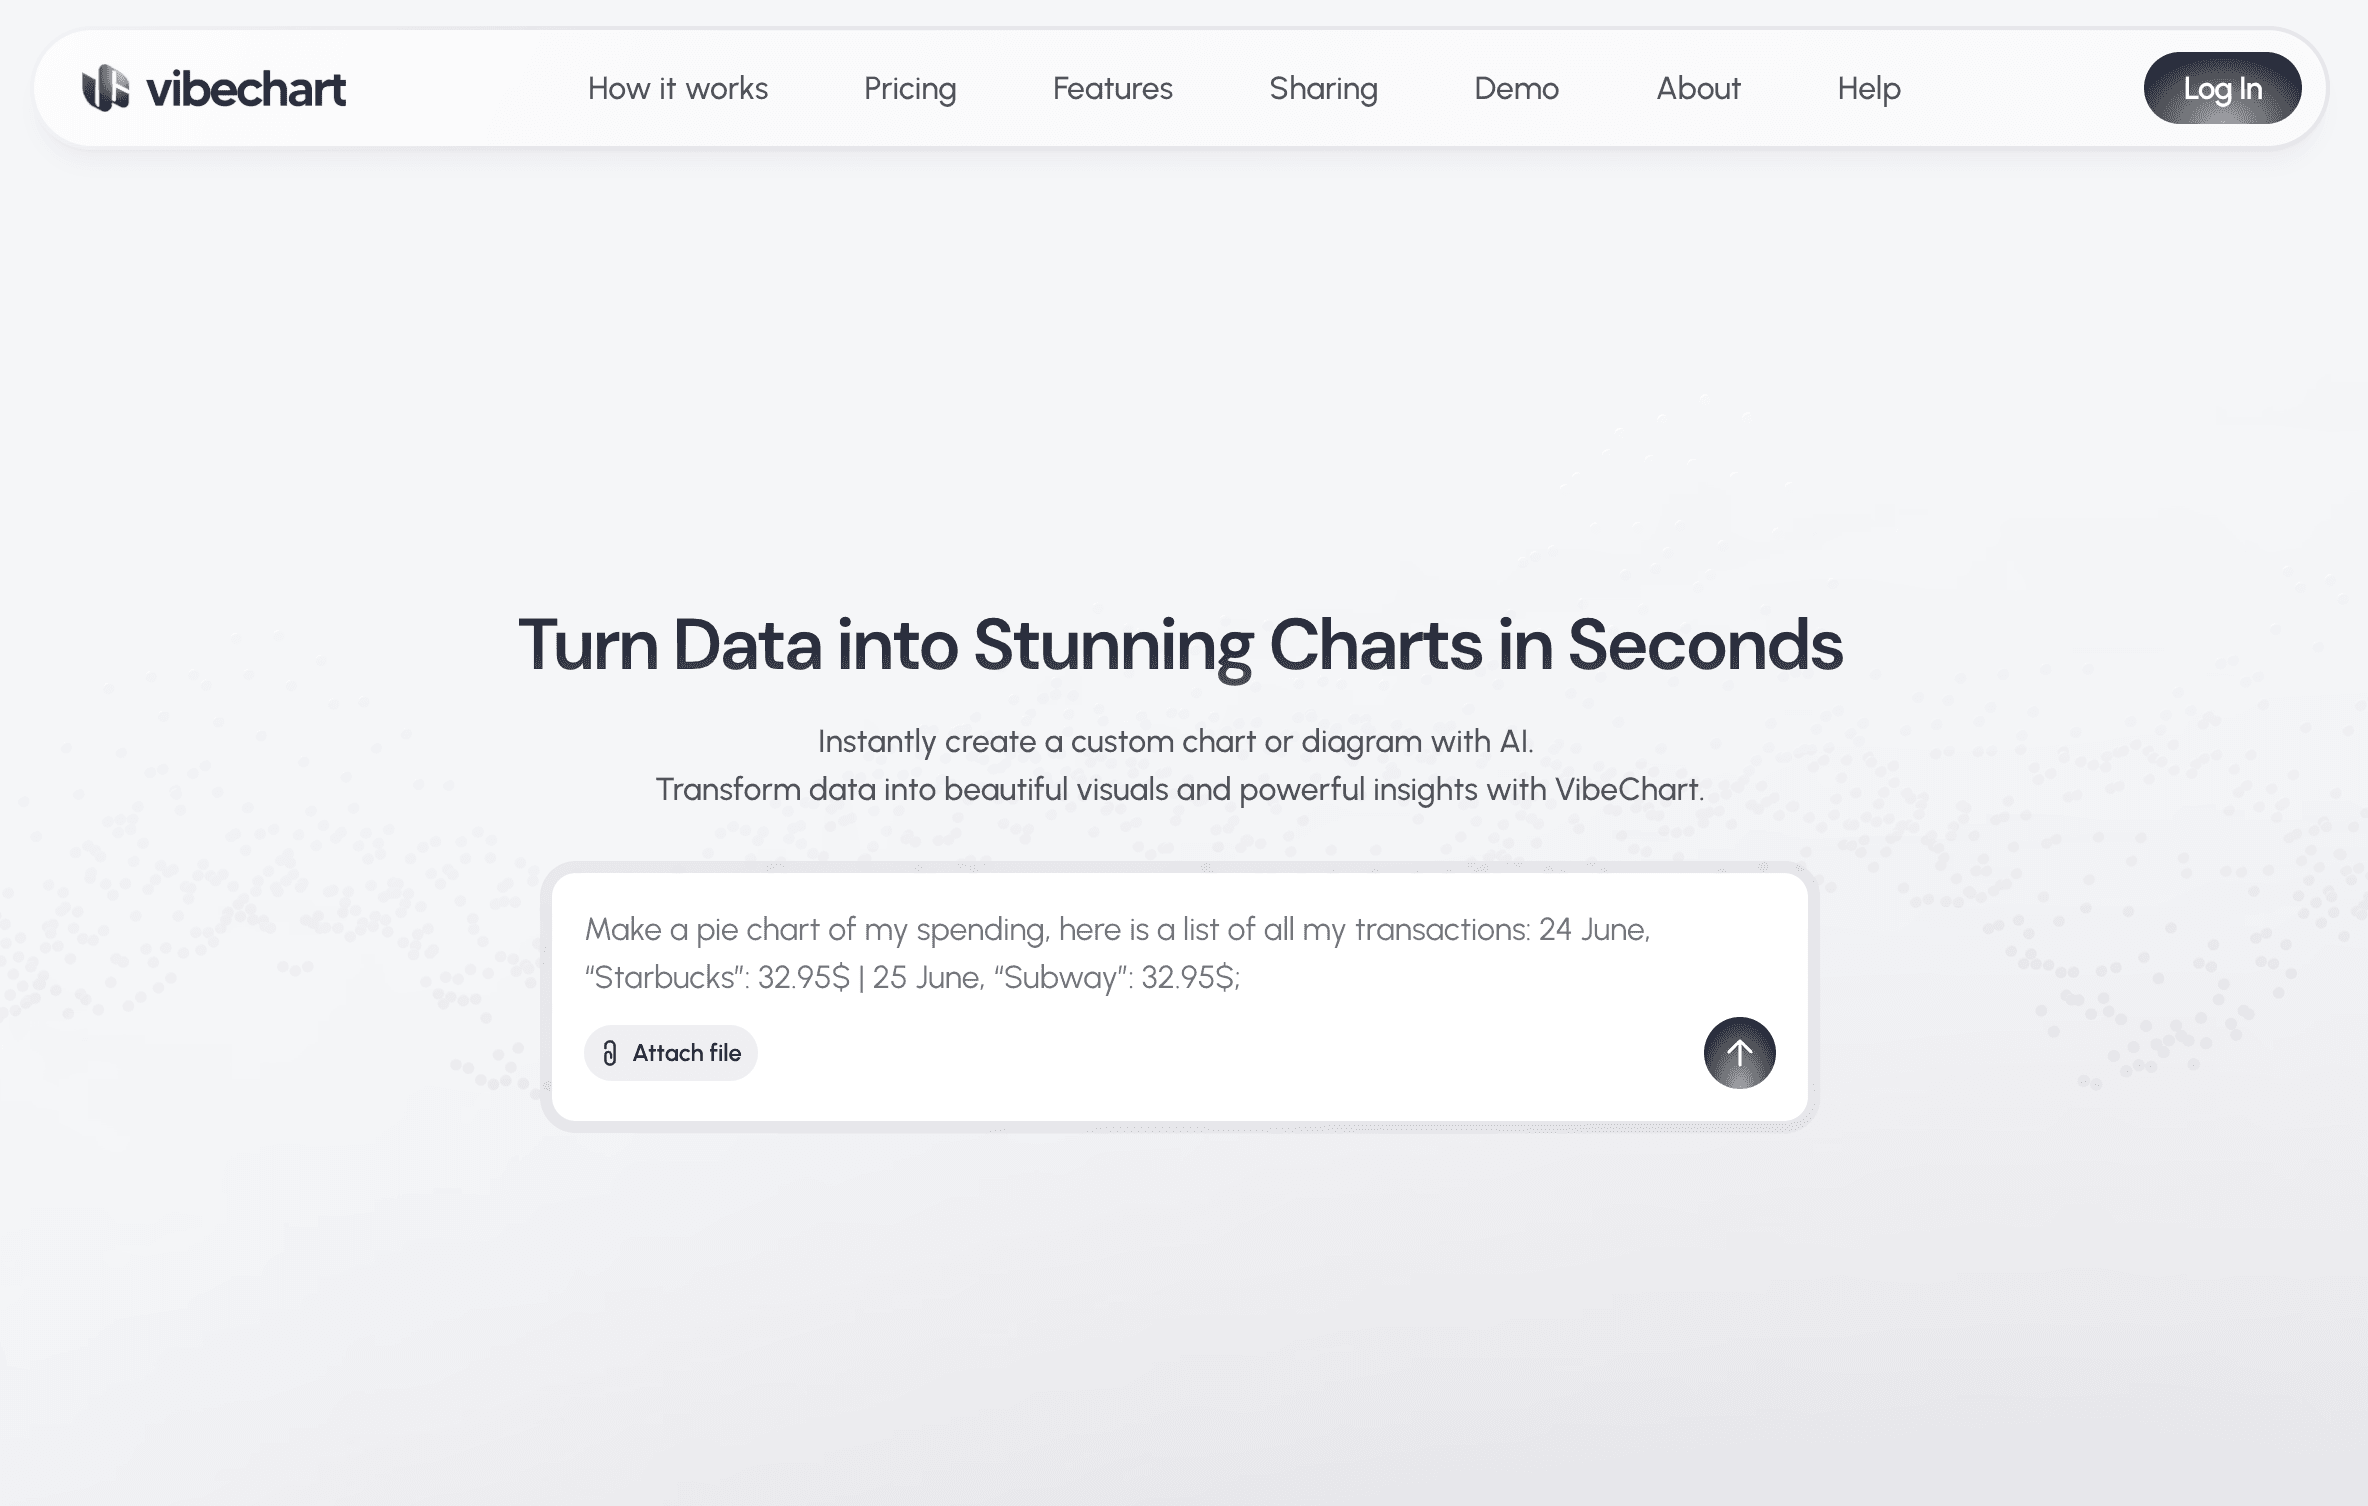
About VibeChart
VibeChart is an AI-enabled tool that is designed to turn data into visually appealing and insightful charts or diagrams instantly. Its key feature includes a unique 'Text-to-Chart' interface that allows users to create and customize over 40 types of charts using plain language and natural data queries. This offers speed, flexibility, and precision to the users while generating these visuals. The tool is equipped with a built-in data engineer to clean, transform, and extract insights from messy data using smart, instructable tools. VibeChart provides high-speed, reliable chart generation through an API, promising high uptime and quick response times. The charts created can be easily shared across multiple platforms as the tool offers the flexibility to export the chart as an image, link, or embedded code. This makes it accommodating for various business and research needs, across different domains like data analytics, product management, surveys, consulting, accounting, investments, and quality assurance, among others. VibeChart helps to eliminate time-consuming manual charting, enabling users to visualize their data smarter and faster.
32
Total Visits
0
Upvotes
Auto
Discovery
Similar Tools
 #33
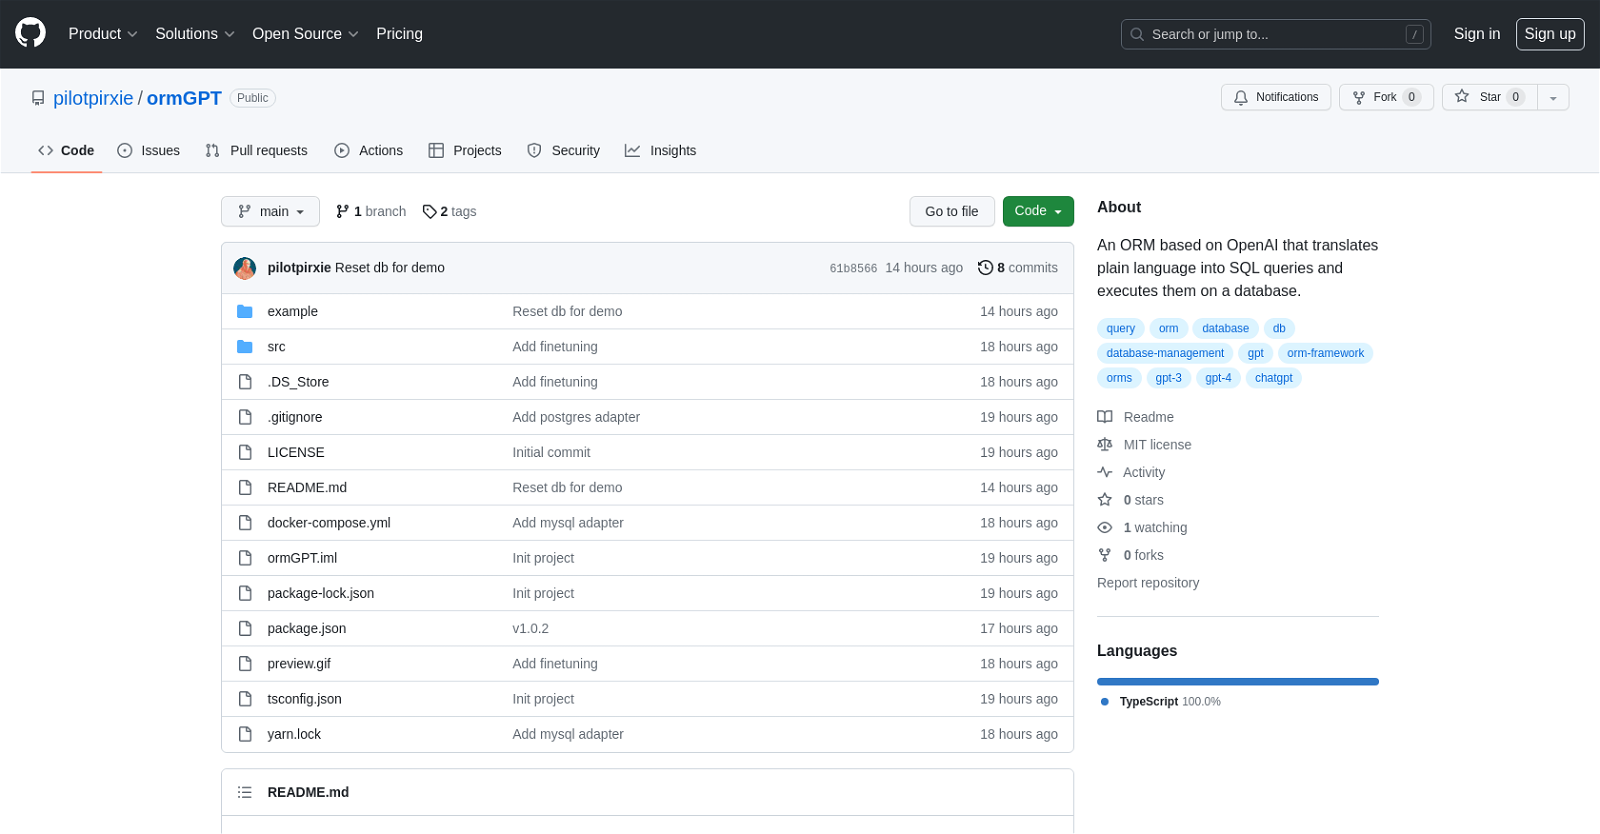
#33ormGPT
Turn plain language into SQL queries and database actions.
 #977,561
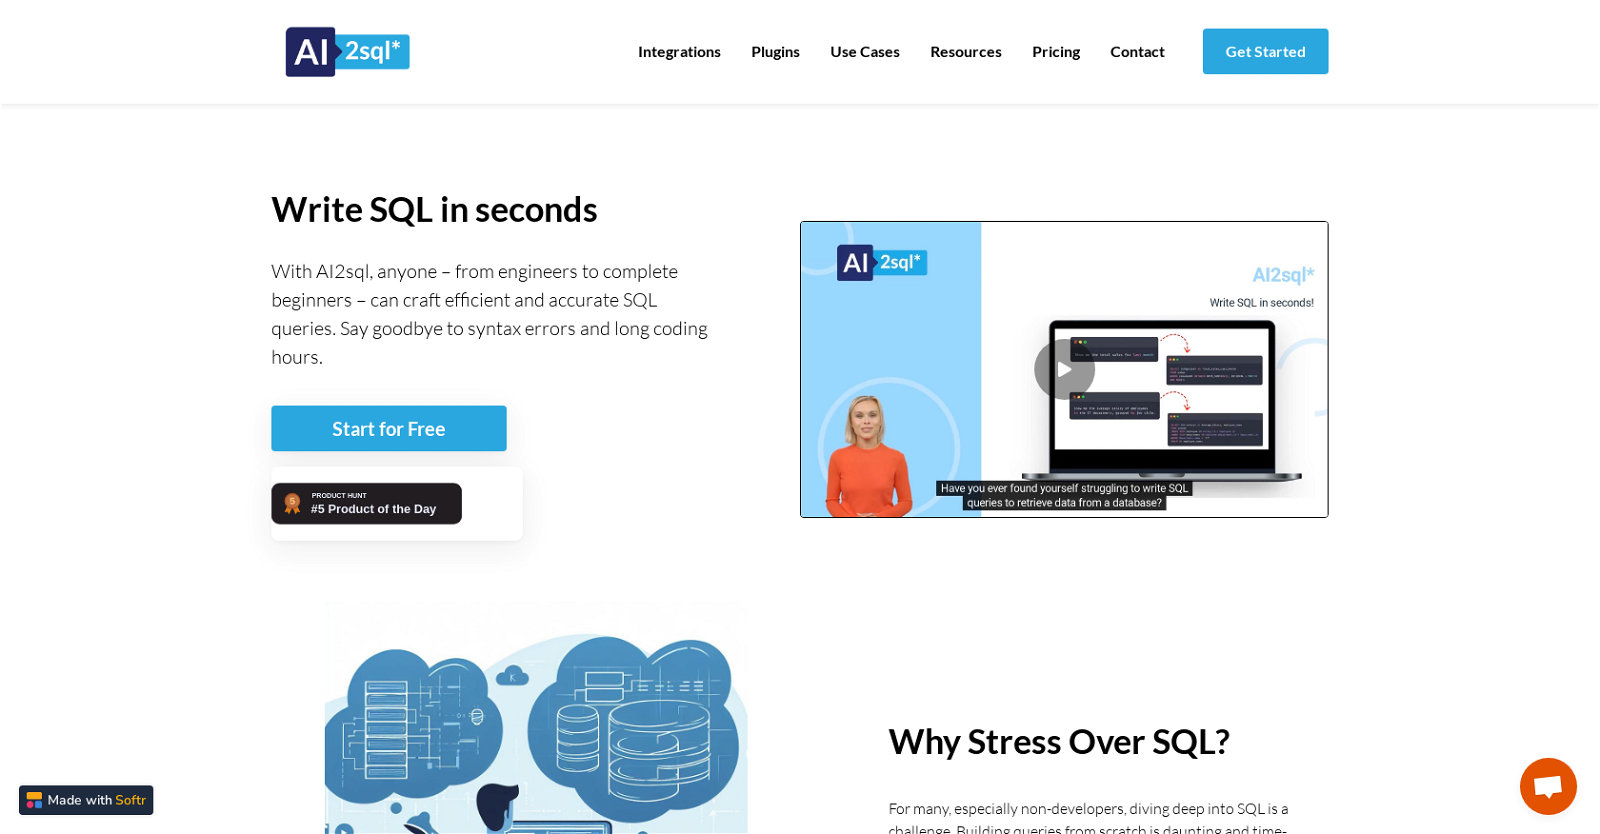
AI2SQL
Build SQL queries effortlessly with AI assistance.
 #525,339
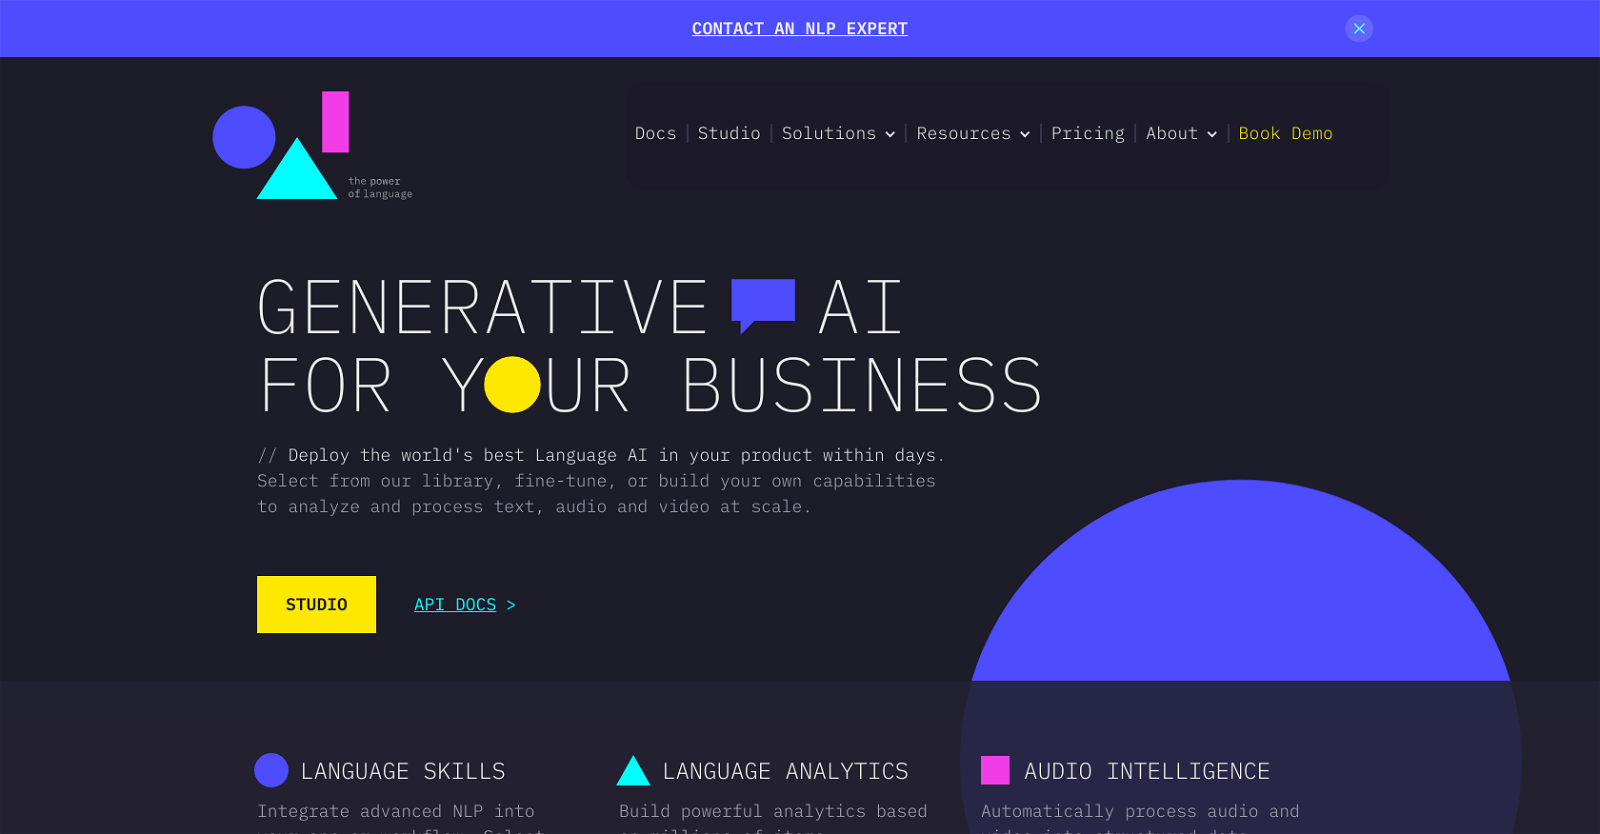
One AI
Process text, audio, and video with cutting-edge language AI.
 #32,929
Lightspeed AI
Ask anything, get instant business insights.